
Scheduled refreshes may be queued while an account has no active users.
Teams relying on background refresh should check the vendor's documented refresh behavior and verify when published or embedded dashboards update.
Evidence source ↗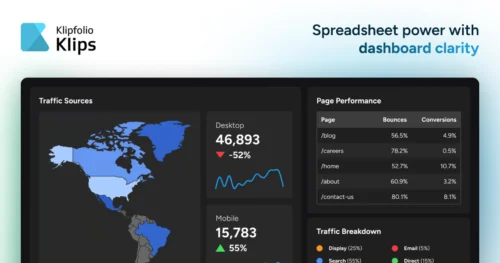
Klipfolio provides cloud analytics products for building and sharing business dashboards. Klips connects data sources and supports custom visualizations, while PowerMetrics focuses on shared metric definitions and analytics.
The product supports many connectors, custom formula-based dashboards, sharing and scheduled reports. Capterra's public rating is positive, while reviews also describe a learning curve for complex dashboards. Refresh speed, dashboard count and some sharing capabilities depend on the selected plan.
This profile combines documented product information and independent evidence where available. It is not a hands-on test unless TechZella explicitly identifies one.
Klipfolio Inc. is an Ottawa-based software company founded in 2001. Its products include Klips, a cloud dashboard and reporting tool, and PowerMetrics, a metric-first analytics platform launched in 2020.
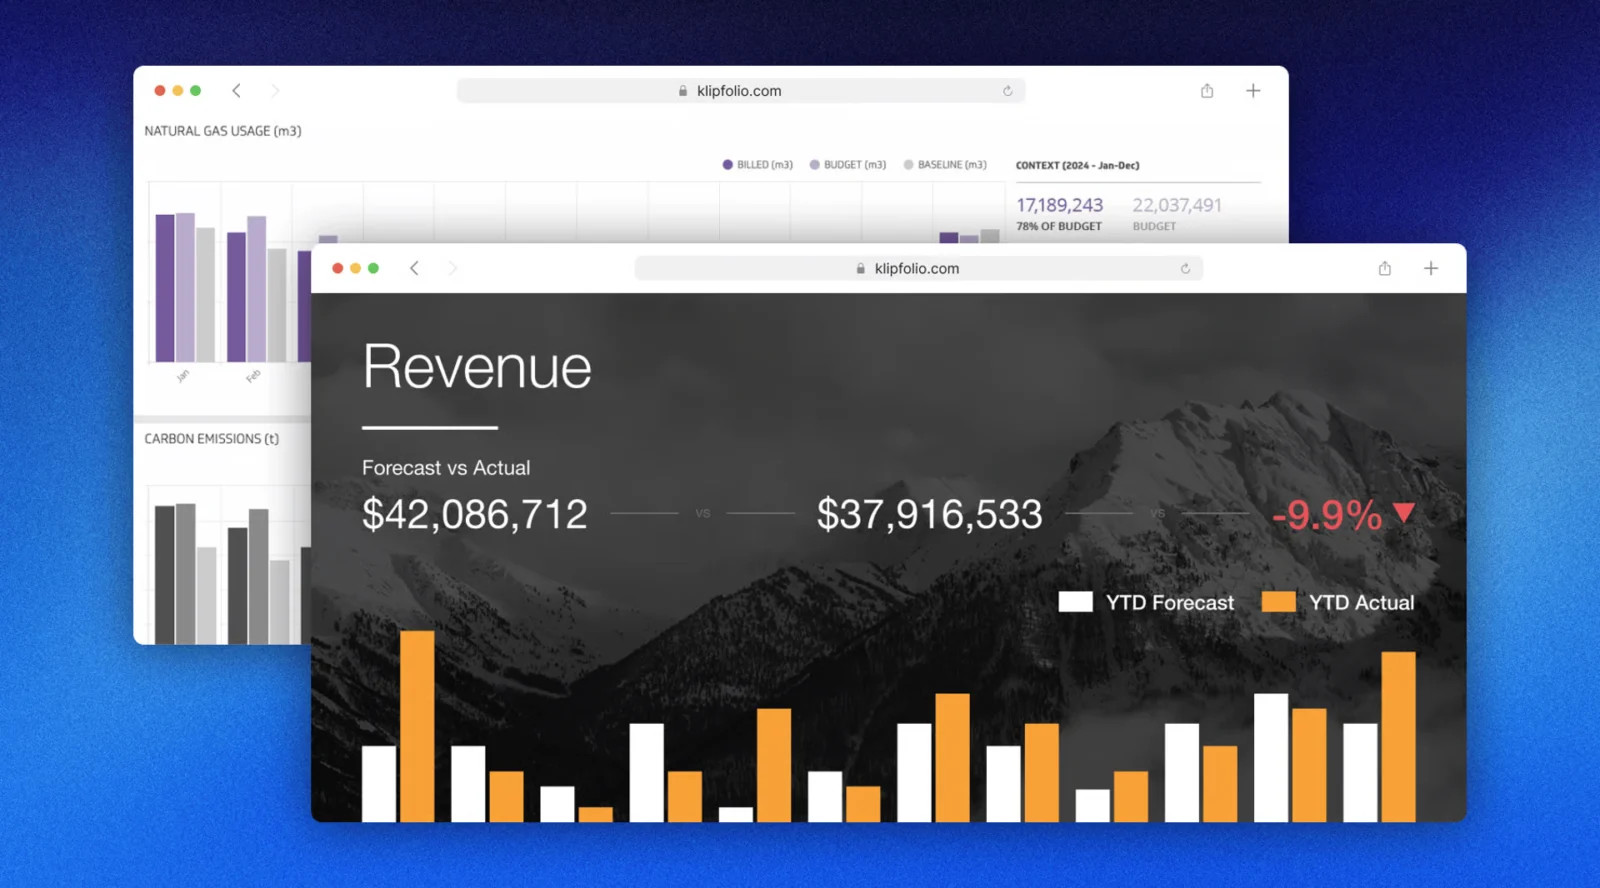
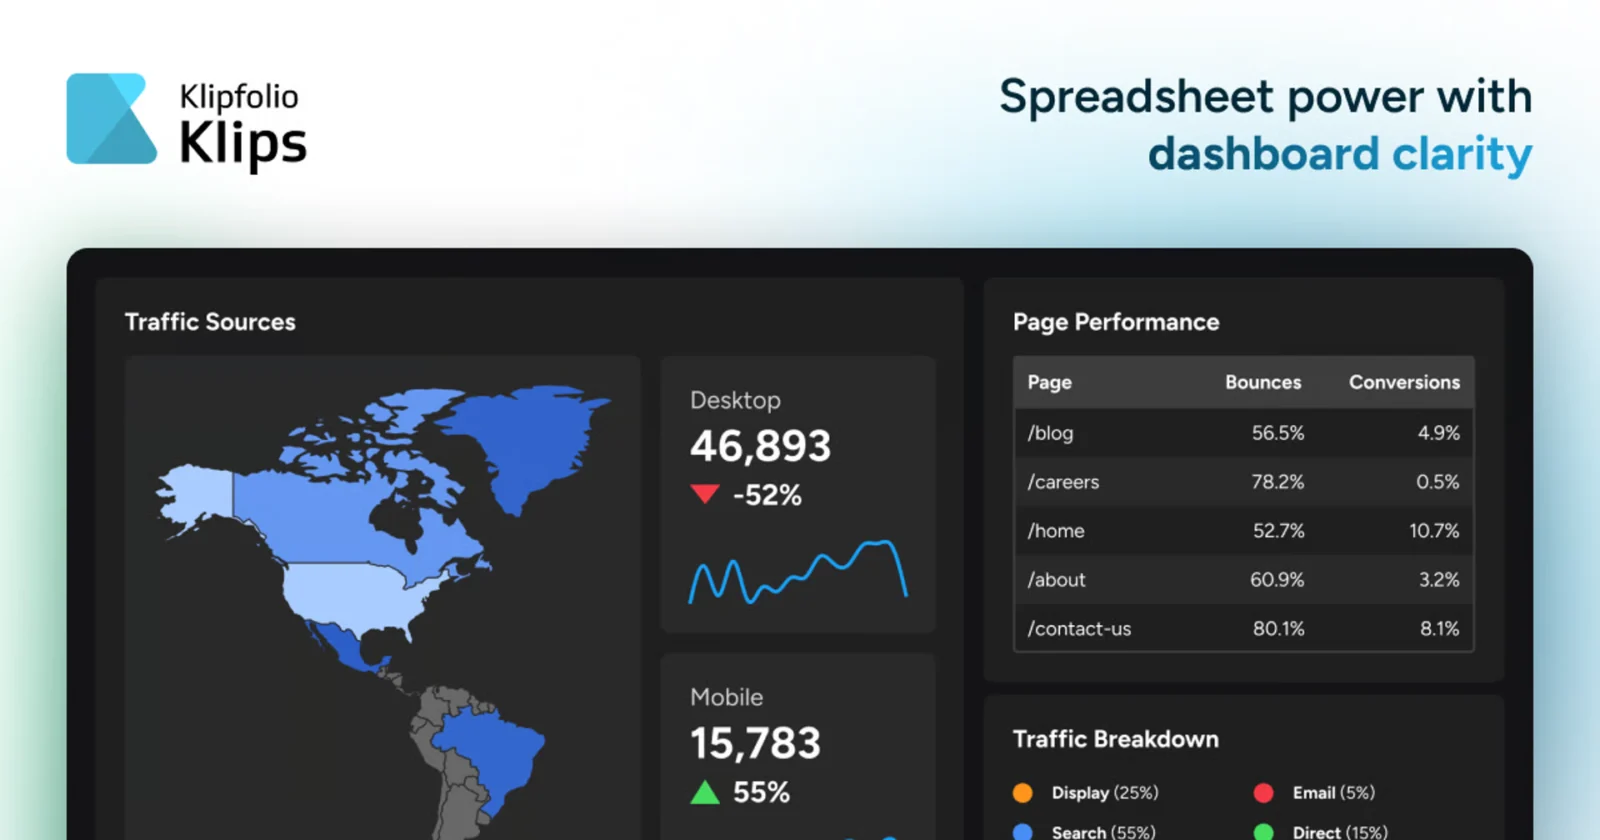
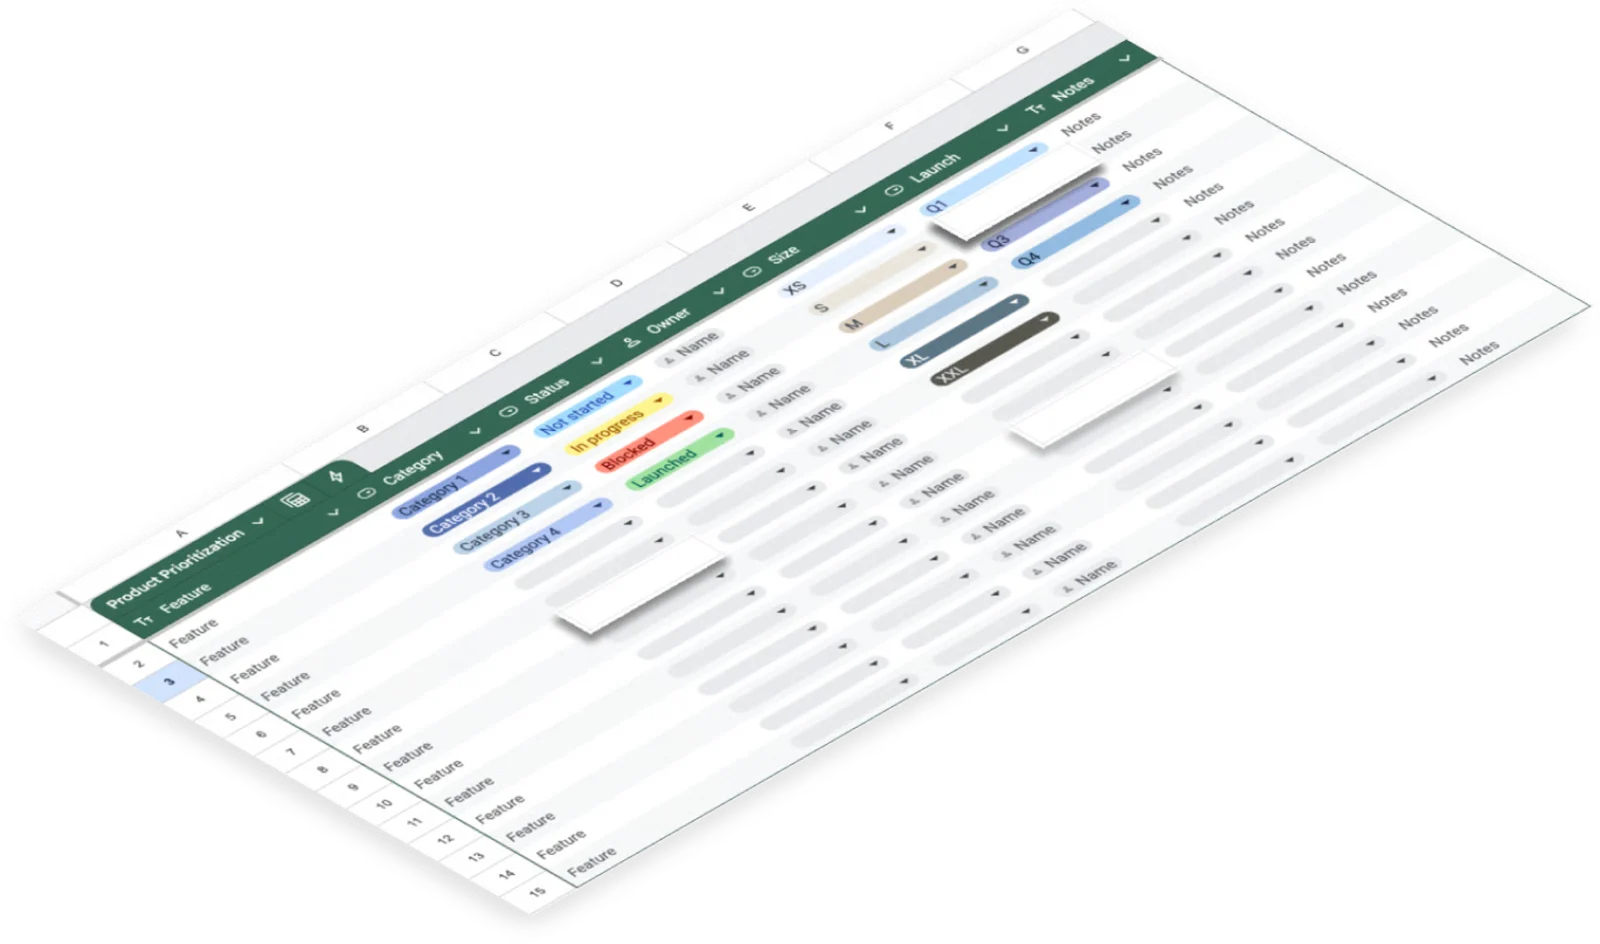
Klips combines data from connected applications, databases, files and APIs into customizable dashboards. The product supports internal reporting and client-facing dashboards, with sharing options such as published links and scheduled email reports.
A quick way to understand who this product may suit, where its limits matter, and which facts are most relevant before you compare alternatives.
Organizations and agencies that need to combine business data from multiple sources into customizable KPI dashboards and scheduled client or team reports.
Teams seeking highly self-service analytics with little formula or data-source configuration may find complex dashboard creation demanding. Klips plan tiers also limit dashboard counts and vary in refresh frequency, and should evaluate alternatives such as Databox: Consider when prebuilt KPI monitoring and metric-focused dashboards align better with the team's workflow. or Microsoft Power BI: Consider when the buyer needs analytics and reporting within Microsoft's broader data and business software ecosystem. instead.
Cloud, Google Chrome Extension, REST API, Web
7.8/10
These are the product-specific differences that may matter when deciding whether the software fits your workflow. They are based on documented evidence rather than a universal ranking.
These are documented constraints or practical friction points that may matter before you adopt the product.
Teams relying on background refresh should check the vendor's documented refresh behavior and verify when published or embedded dashboards update.
Evidence source ↗An API that requires an initial login request or another unsupported authentication step may need a different connection approach.
Evidence source ↗Trial users can evaluate the service without entering payment information, but must select a plan to continue after the trial.
Evidence source ↗3 dashboards, unlimited users, four-hour data refresh, 130+ integrations, data modeling and joins, PDF reports, template gallery and logo customization.
Check current pricing →10 dashboards, unlimited users, one-hour data refresh; adds published links and scheduled reports to Base features.
Check current pricing →20 dashboards, unlimited users, 15-minute data refresh; adds SSO and warm-up refresh to Grow features.
Check current pricing →40 dashboards, unlimited users, up-to-the-minute refresh, six hours of custom onboarding during the first three months and priority support.
Check current pricing →Trial access to Klips; the vendor states payment information is requested only when purchasing a plan.
Check current pricing →Pricing may change. Verify current plans on the vendor's website.


| Deployment | Cloud SaaS |
|---|---|
| Supported access | Web browser; smartphone browser viewing documented |
| Integrations | 130+ listed integrations |
| API | REST API; REST/URL data connector |
| API rate limit | Up to five API requests per second; daily request limits depend on plan |
| Free trial | 14 days |
| Dashboard limits | 3, 10, 20 or 40 across listed Klips plans |
| Data refresh | Plan intervals range from four hours to up-to-the-minute |
| Security update | SOC 2 Type I attestation announced September 2026 |
Verified installation, hosting, administration, or environment details that can affect implementation.
| Installation or hosting | Klipfolio describes its service as SaaS; Klips dashboards are delivered through the web application. Source ↗ |
|---|
Databox may suit teams prioritizing prebuilt KPI dashboards and simplified monitoring workflows. Looker Studio may fit teams centered on Google data and reporting. Microsoft Power BI may be more appropriate for organizations needing deeper analytics within Microsoft’s reporting ecosystem. Compare current product capabilities and plans against the specific data and sharing requirements.
A proprietary editorial score based on product capabilities, usability, value, performance, support and user sentiment evidence.
The product supports many connectors, custom formula-based dashboards, sharing and scheduled reports. Capterra's public rating is positive, while reviews also describe a learning curve for complex dashboards. Refresh speed, dashboard count and some sharing capabilities depend on the selected plan.
Methodology v1.0. The assessment weighs feature coverage (25%), ease of use (15%), value for money (20%), performance (15%), support (10%) and user sentiment (15%), using researched product evidence and verified review evidence where available. It is a TechZella editorial assessment, not a direct user-review average.
Key claims are linked to the sources used to verify them. This evidence record is separate from third-party user ratings.
TechZella evaluates software using documented product capabilities, pricing information, usability and value considerations, independent user evidence where available, and competitive context. The assessment is an editorial review, not a hands-on test unless one is explicitly identified. Our editorial assessment is based on 5 documented sources.
The company history identifies 2001 as its founding year and Ottawa as its founding location.
View source ↗Verified 2026-11-07The official pricing page lists Base, Grow, Team and Team+ with 3, 10, 20 and 40 dashboards respectively, and refresh intervals ranging from four hours to up-to-the-minute.
View source ↗Verified 2026-11-07The pricing page states the trial lasts 14 days and that payment information is requested when purchasing a plan.
View source ↗Verified 2026-11-07The integrations page describes prebuilt connectors and REST API connectivity, with examples across business applications, databases and files.
View source ↗Verified 2026-11-07The API reference describes HTTPS REST endpoints and JSON responses for managing those assets.
View source ↗Verified 2026-11-07The product updates page says an independent assessment completed by AssurancePoint, LLC confirmed the design of key controls against SOC 2 Trust Services Criteria at a point in time.
View source ↗Verified 2026-11-07Answers begin with the clearest available response, followed by the context that helps you act on it.
No reviews yet. Be the first to share your experience.
Please log in to submit a review.