
Grafana Cloud integrations are exclusive to Grafana Cloud.
Self-managed users can use data sources and plugins, but must configure collection, dashboards, and alerting themselves when they need an equivalent packaged setup.
Evidence source ↗
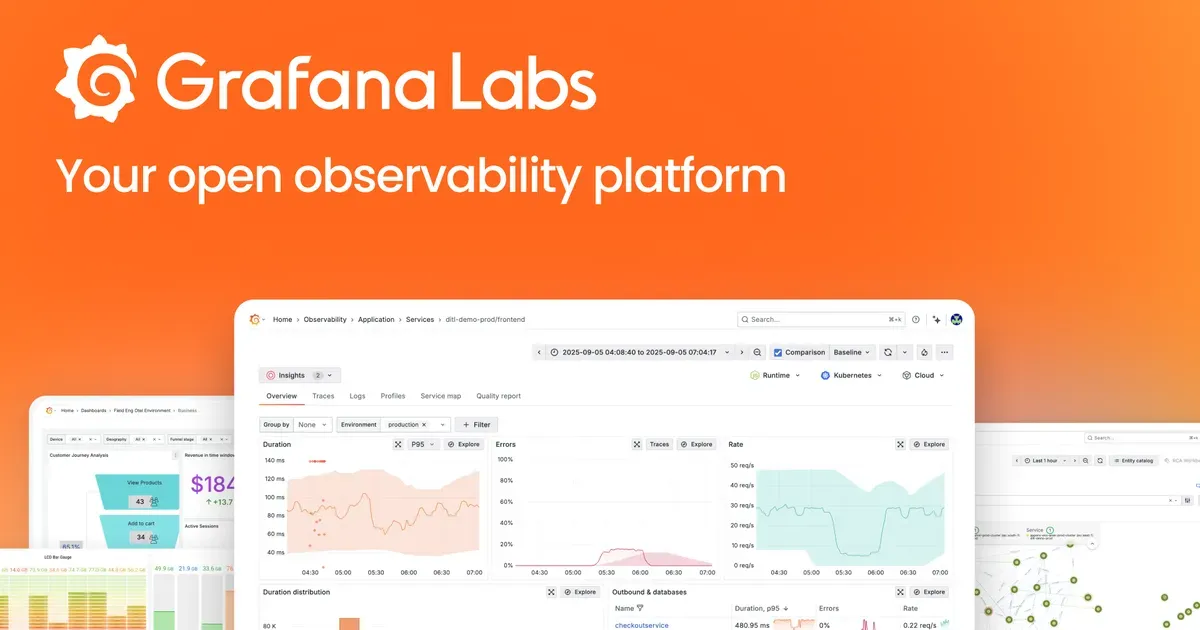
Grafana queries and visualizes metrics, logs, traces, and other data in dashboards. It is available as self-managed open-source software and as the managed Grafana Cloud service.
The product supports many data sources, dashboards, plugins, and alerting workflows, with both self-managed and managed options. Gartner Peer Insights lists a 4.5-star rating from 422 ratings. Self-managed deployment and data-source configuration can require technical work; scores are editorial assessments, not hands-on test results.
This profile combines documented product information and independent evidence where available. It is not a hands-on test unless TechZella explicitly identifies one.
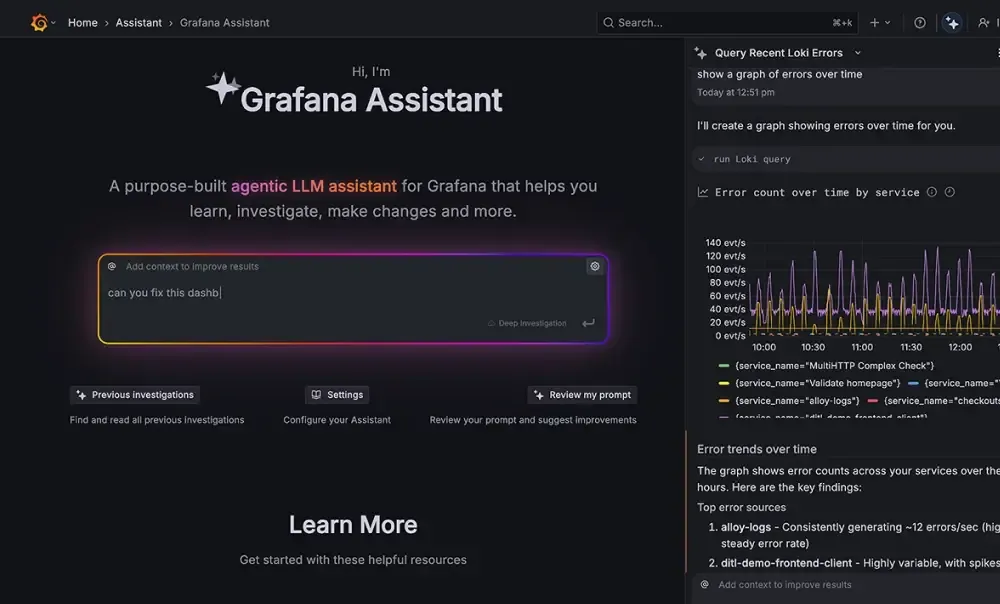
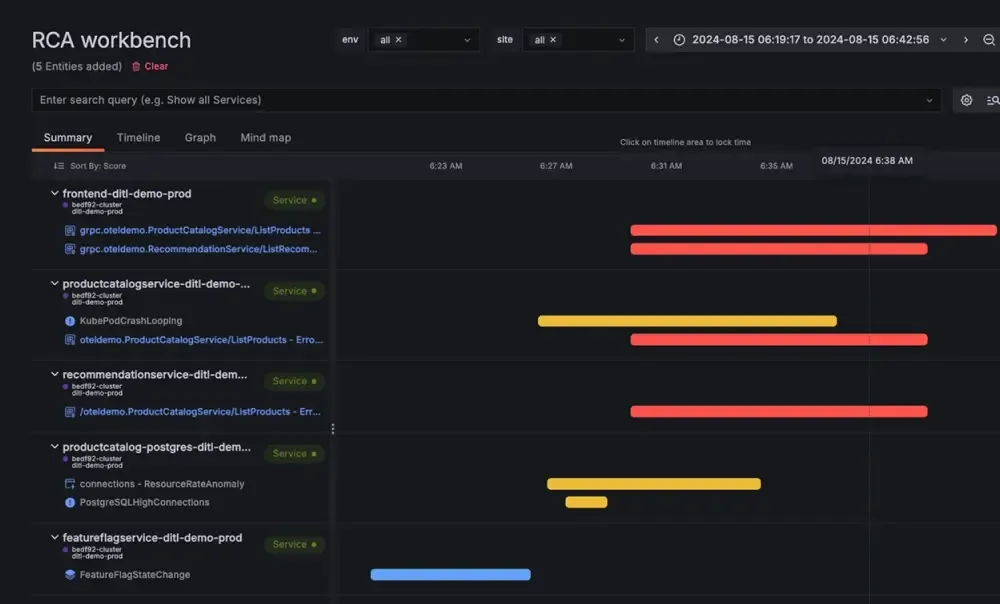
Grafana is a dashboarding and visualization platform for metrics, logs, traces, and other data. It queries connected data sources and presents results in dashboards, Explore, and alerting workflows.
Organizations can run Grafana themselves or use Grafana Cloud. The deployment choice matters: Cloud provides managed storage and packaged integrations, while self-managed installations connect to separately operated data backends.
A quick way to understand who this product may suit, where its limits matter, and which facts are most relevant before you compare alternatives.
Engineering, IT, and operations teams that need configurable dashboards and alerts across multiple telemetry sources, especially teams able to manage their own observability stack or choose Grafana Cloud.
Teams seeking a single self-managed Grafana installation that also provides managed telemetry storage and prepackaged Grafana Cloud integrations; those capabilities depend on deployment choice, and should evaluate alternatives such as New Relic or Datadog instead.
Docker, Kubernetes, SaaS, Self-hosted, Web
8.1/10
These are the product-specific differences that may matter when deciding whether the software fits your workflow. They are based on documented evidence rather than a universal ranking.
These are documented constraints or practical friction points that may matter before you adopt the product.
Self-managed users can use data sources and plugins, but must configure collection, dashboards, and alerting themselves when they need an equivalent packaged setup.
Evidence source ↗A buyer should estimate telemetry volume and retention needs rather than treating the starting price as the total service cost.
Evidence source ↗Free Grafana Cloud access with service usage limits, community support, and listed 14-day retention for metrics, logs, traces, profiles, and k6 performance tests.
Check current pricing →Self-serve paid plan with higher usage limits, longer retention, and 8x5 email support.
Check current pricing →Full-service plan for organizations with security, compliance, and deployment requirements.
Check current pricing →Open-source Grafana software for self-managed installation; infrastructure and connected data-backend costs are separate.
Check current pricing →Pricing may change. Verify current plans on the vendor's website.
Compare similar products directly, then see which alternatives may make more sense when your requirements differ.
| Decision factor | Grafana | New Relic | Datadog |
|---|---|---|---|
| Deployment model | Grafana is available as self-managed software or managed Grafana Cloud. | New Relic describes its free tier as access to its cloud-based observability platform. Source ↗ | Datadog describes its infrastructure monitoring as SaaS-based. Source ↗ |
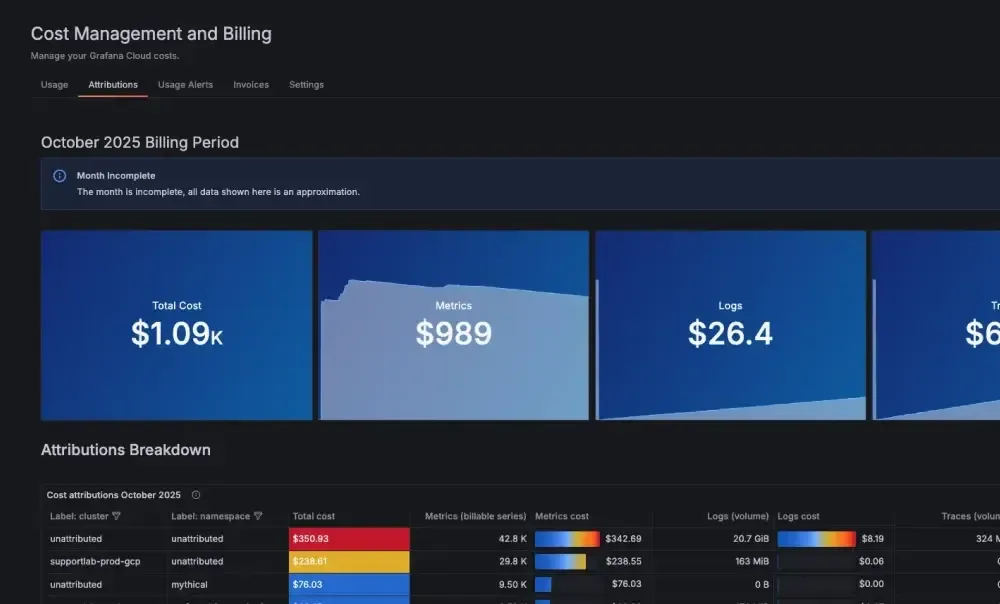
| Pricing model | Grafana Cloud Free is $0; Pro starts at $19 per month plus usage. Grafana OSS is available for self-managed use. | New Relic provides a free tier with 100 GB monthly data ingest and describes paid usage beyond free limits. Source ↗ | Datadog lists infrastructure plans priced per host per month, with annual, monthly, and on-demand prices. Source ↗ |
| Free offering | Grafana Cloud offers an always-free plan with usage limits and no time-limited trial. | New Relic's free tier includes 100 GB monthly data ingest, one full platform user, and unlimited basic users. Source ↗ | Datadog offers a free tier after its free trial, with up to five Basic hosts and one-day metric retention. Source ↗ |
Only factors supported by the available research are shown. The comparison is descriptive, not a ranking.
These products address broadly similar requirements. The descriptions focus on documented reasons a buyer might compare them with Grafana.

| Deployment | Grafana Cloud SaaS or self-managed |
|---|---|
| Supported installation environments | Debian or Ubuntu, RHEL or Fedora, SUSE or openSUSE, macOS, Windows, Docker, and Kubernetes |
| API | HTTP API; documentation describes OpenAPI v2 and v3 specifications |
| API authentication | Basic authentication or service-account token for OSS; service-account token for Grafana Cloud |
| Data sources | Examples include Prometheus, Loki, Elasticsearch, MySQL, PostgreSQL, Microsoft SQL Server, AWS CloudWatch, Azure Monitor, and Google Cloud Monitoring |
| Grafana Cloud Free retention | 14 days for listed metrics, logs, traces, profiles, and k6 performance tests |
| Grafana Cloud Pro retention | 13 months for metrics; 30 days for logs, traces, profiles, and k6 performance tests |
| Free trial | Grafana Cloud offers an always-free plan rather than a time-limited trial |
Verified installation, hosting, administration, or environment details that can affect implementation.
| Installation or hosting | Grafana can be self-managed on supported operating systems, in Docker, or on Kubernetes. Grafana Cloud is the managed SaaS option. Source ↗ |
|---|---|
| Data-source model | Grafana connects to storage backends such as Prometheus, Loki, SQL databases, and cloud monitoring services; Grafana Cloud also provides managed observability storage. Source ↗ |
Documented portability, standards, export, or switching considerations. No switching-cost score is shown unless the evidence supports one.
Grafana's HTTP API supports programmatic management of resources including dashboards and data sources. The documentation distinguishes Grafana instance APIs from Grafana Cloud APIs.
Evidence source ↗A proprietary editorial score based on product capabilities, usability, value, performance, support and user sentiment evidence.
The product supports many data sources, dashboards, plugins, and alerting workflows, with both self-managed and managed options. Gartner Peer Insights lists a 4.5-star rating from 422 ratings. Self-managed deployment and data-source configuration can require technical work; scores are editorial assessments, not hands-on test results.
Methodology v1.0. The assessment weighs feature coverage (25%), ease of use (15%), value for money (20%), performance (15%), support (10%) and user sentiment (15%), using researched product evidence and verified review evidence where available. It is a TechZella editorial assessment, not a direct user-review average.
Key claims are linked to the sources used to verify them. This evidence record is separate from third-party user ratings.
TechZella evaluates software using documented product capabilities, pricing information, usability and value considerations, independent user evidence where available, and competitive context. The assessment is an editorial review, not a hands-on test unless one is explicitly identified. Our editorial assessment is based on 7 documented sources.
Official documentation presents Grafana OSS and Grafana Cloud and describes Cloud as a managed service.
View source ↗Verified 2026-11-08Documentation names Prometheus, Loki, SQL databases, cloud monitoring services, and other supported or plugin-based sources.
View source ↗Verified 2026-11-08Grafana Cloud documentation describes the Free plan as having no cost, no credit card requirement, and no time-limited trial.
View source ↗Verified 2026-11-08The official pricing page lists Pro from $19 per month plus usage.
View source ↗Verified 2026-11-08The API documentation lists resource management including dashboards, users, data sources, alerts, and other resources.
View source ↗Verified 2026-11-08The installation documentation lists supported Linux distributions, macOS, Windows, Docker, and Kubernetes deployment.
View source ↗Verified 2026-11-08Documentation says integrations bundle collection configuration, dashboards, and alerting, and are exclusive to Grafana Cloud.
View source ↗Verified 2026-11-08See the product-specific buyer questions below for verified details about Grafana Cloud’s free plan, pricing, deployment, and API.
No reviews yet. Be the first to share your experience.
Please log in to submit a review.