
Zoho Analytics plan limits include user and row counts, and additional rows are available as add-ons.
Teams should estimate both stored rows and private-user seats rather than comparing only the starting subscription price.
Evidence source ↗
Zoho Analytics is a business intelligence and analytics platform for connecting, preparing, analyzing, and visualizing business data. Its 2026 release adds AI agents for analytics workflows.
Scores reflect documented data connectors, preparation, dashboards, APIs, cloud and on-premises options, published plan limits, and public G2 review information. They are editorial assessments, not hands-on test results.
This profile combines documented product information and independent evidence where available. It is not a hands-on test unless TechZella explicitly identifies one.
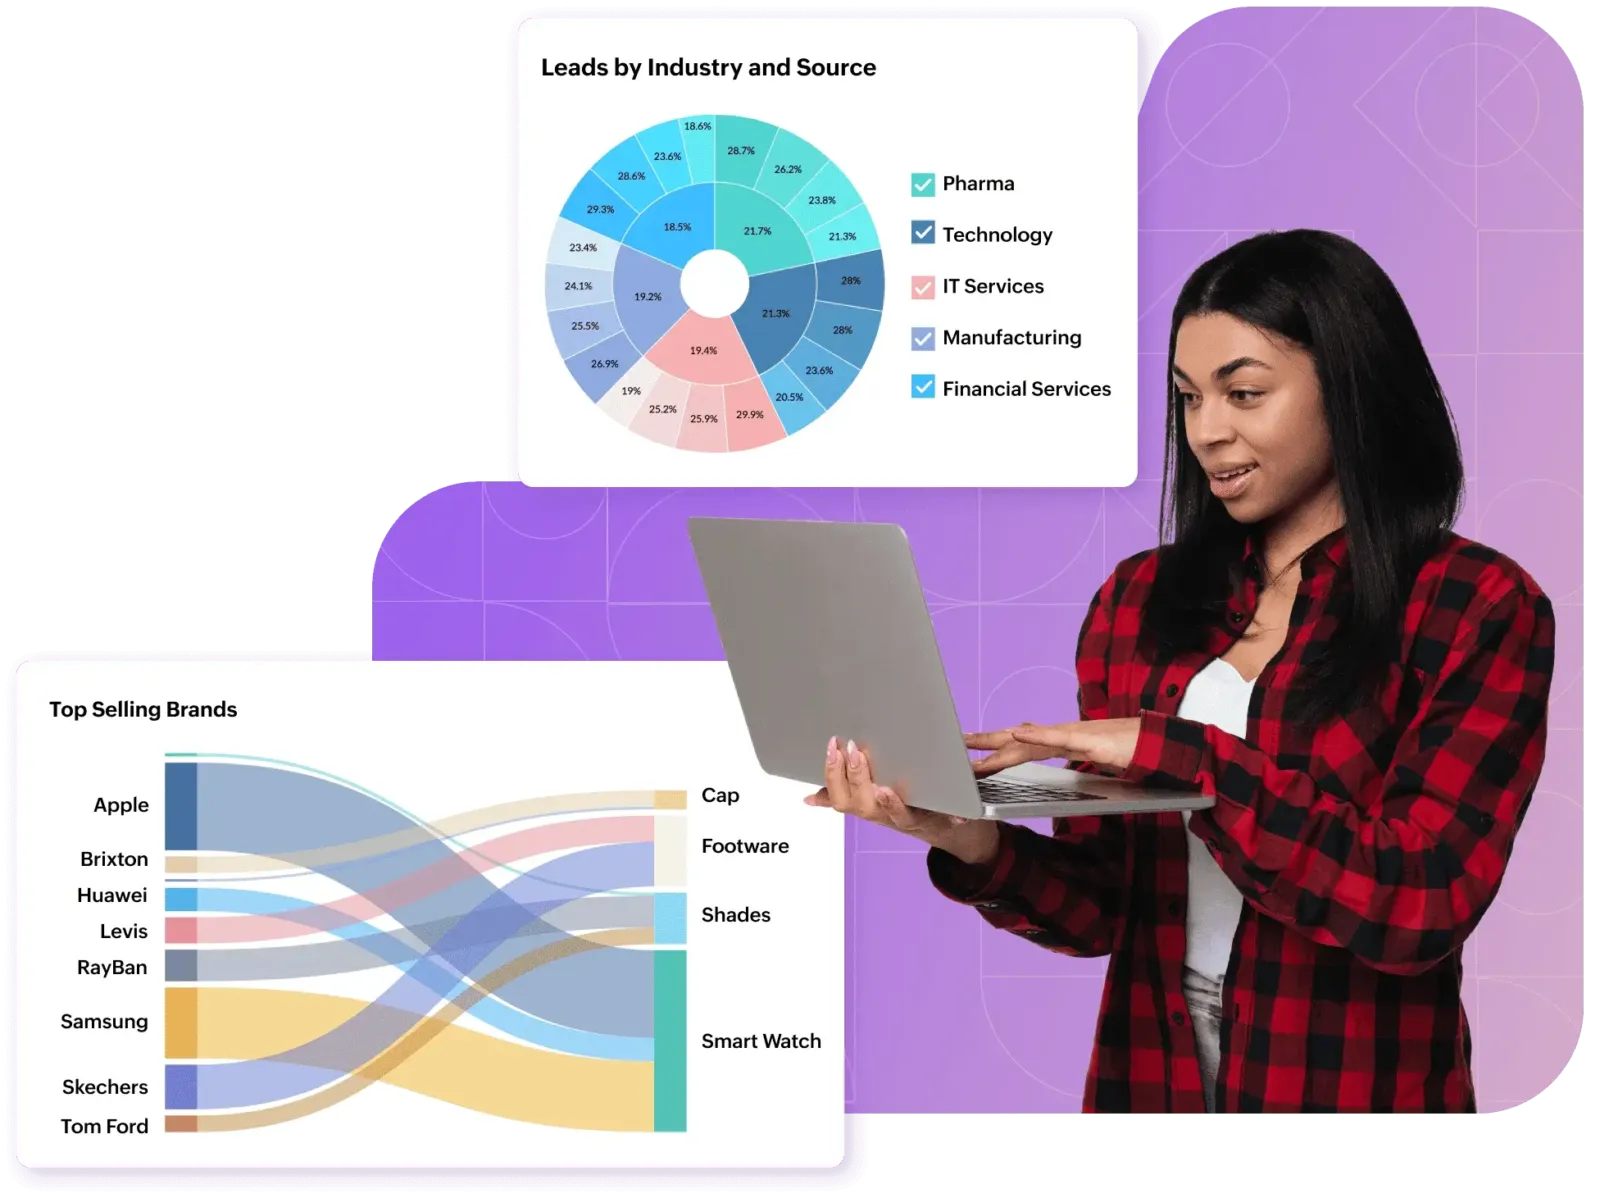
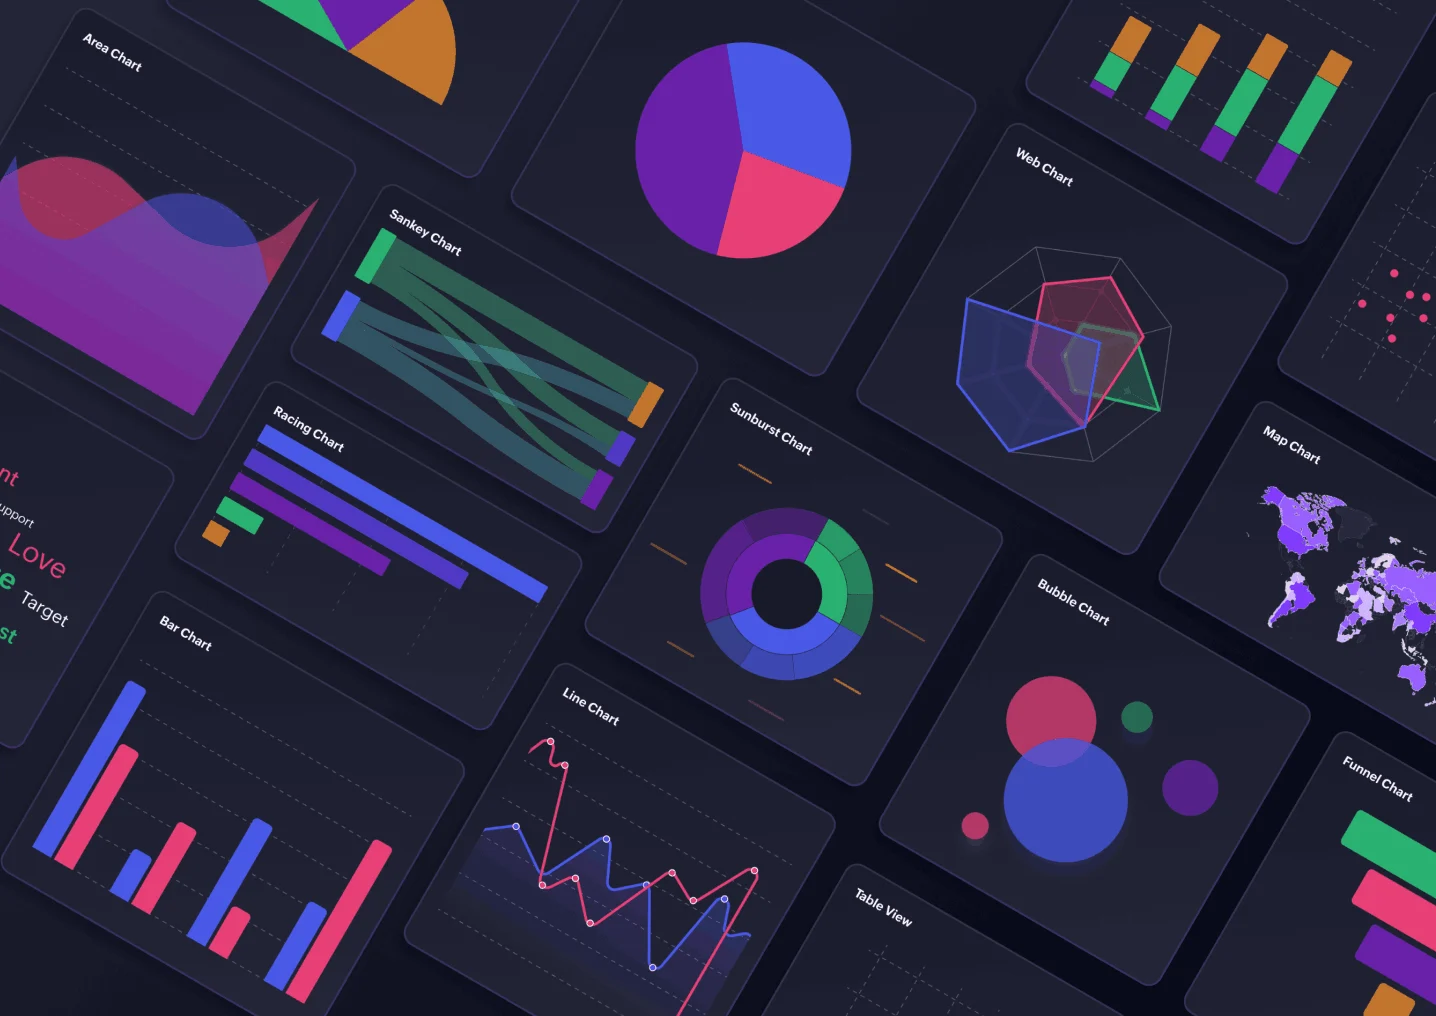
Zoho Analytics is a business intelligence platform for importing, preparing, analyzing, and presenting data. It connects to business applications, databases, data lakes, files, and feeds, then supports interactive reports and dashboards.
Its October 2026 release expands the product toward agentic analytics. Ask Zia coordinates specialized agents for data analysis, dashboards, data preparation, metrics, SQL, and code. Zoho says these features are rolling out gradually; the on-premises release is planned for Q1 2027.
A quick way to understand who this product may suit, where its limits matter, and which facts are most relevant before you compare alternatives.
Organizations seeking one platform to connect business data, prepare it, and build interactive dashboards, especially teams using Zoho applications or requiring on-premises deployment.
Buyers needing the newly announced AI features immediately in every region or on-premises should verify feature availability; Zoho says rollout is gradual and on-premises updates are planned for Q1 2027, and should evaluate alternatives such as Microsoft Power BI or Tableau instead.
Android, Cloud, iOS, On-premises, Web
8.2/10
These are the product-specific differences that may matter when deciding whether the software fits your workflow. They are based on documented evidence rather than a universal ranking.
These are documented constraints or practical friction points that may matter before you adopt the product.
Teams should estimate both stored rows and private-user seats rather than comparing only the starting subscription price.
Evidence source ↗A dashboard built from frequently changing local files may need additional setup or manual imports to stay current.
Evidence source ↗Organizations should confirm feature availability for their location and deployment before making an AI capability a purchase requirement.
Evidence source ↗Free plan supports 2 users, 10,000 rows, and 5 workspaces.
Check current pricing →Starts at 2 users and 0.5 million rows.
Check current pricing →Starts at 5 users and 1 million rows.
Check current pricing →Starts at 15 users and 5 million rows.
Check current pricing →Starts at 50 users and 50 million rows.
Check current pricing →Customized dedicated-compute plans; listed as starting at 50 users and 500 million rows.
Check current pricing →Pricing may change. Verify current plans on the vendor's website.
Compare similar products directly, then see which alternatives may make more sense when your requirements differ.
| Decision factor | Zoho Analytics | Microsoft Power BI | Tableau |
|---|---|---|---|
| Deployment model | Cloud service or on-premises edition is offered. | Power BI is presented as Microsoft’s cloud analytics service, with desktop authoring and capacity options described separately. Source ↗ | Tableau lists Tableau Cloud and Tableau Server pricing editions. Source ↗ |
| Pricing model | Free plan plus paid subscriptions beginning at US$24/month when billed annually; paid plans have user and row limits. | Microsoft lists per-user Power BI Pro and Premium Per User plans; see its live pricing page for current prices. Source ↗ | Tableau Cloud Standard Creator is listed at US$75 per user/month, billed annually. Source ↗ |
Only factors supported by the available research are shown. The comparison is descriptive, not a ranking.
These products address broadly similar requirements. The descriptions focus on documented reasons a buyer might compare them with Zoho Analytics.
| Product type | Business intelligence and analytics software |
|---|---|
| Deployment | Cloud and on-premises |
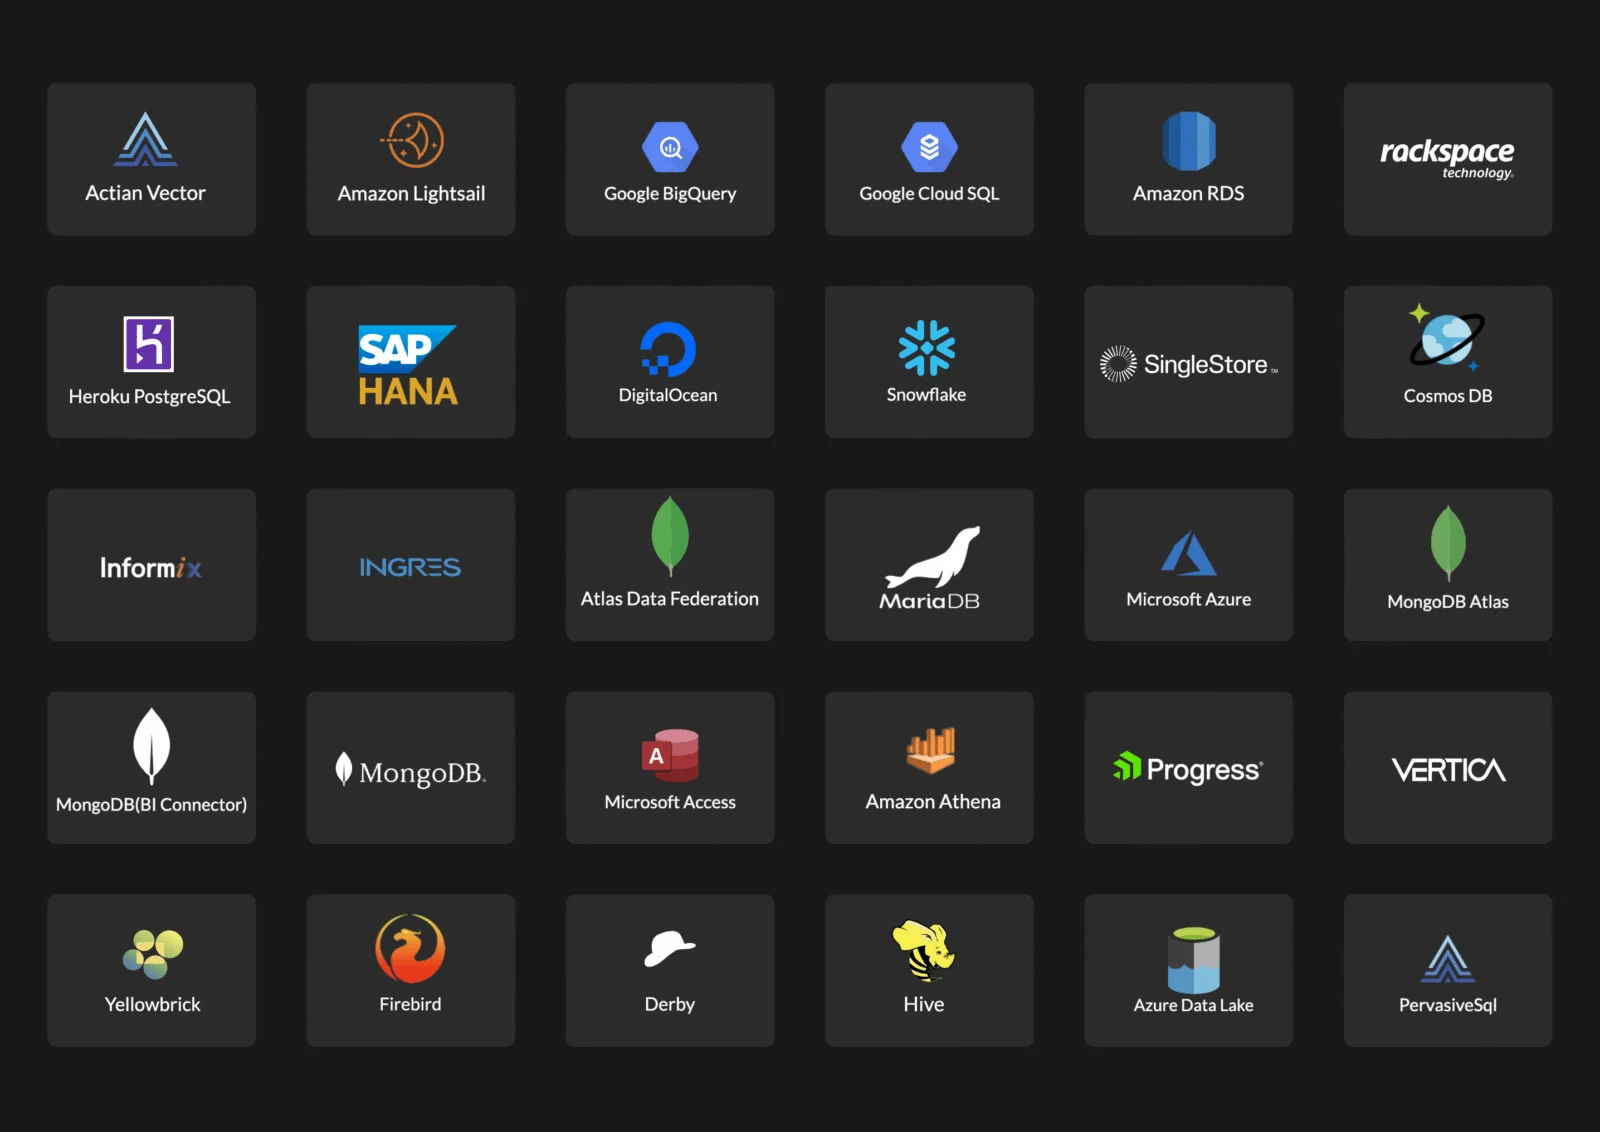
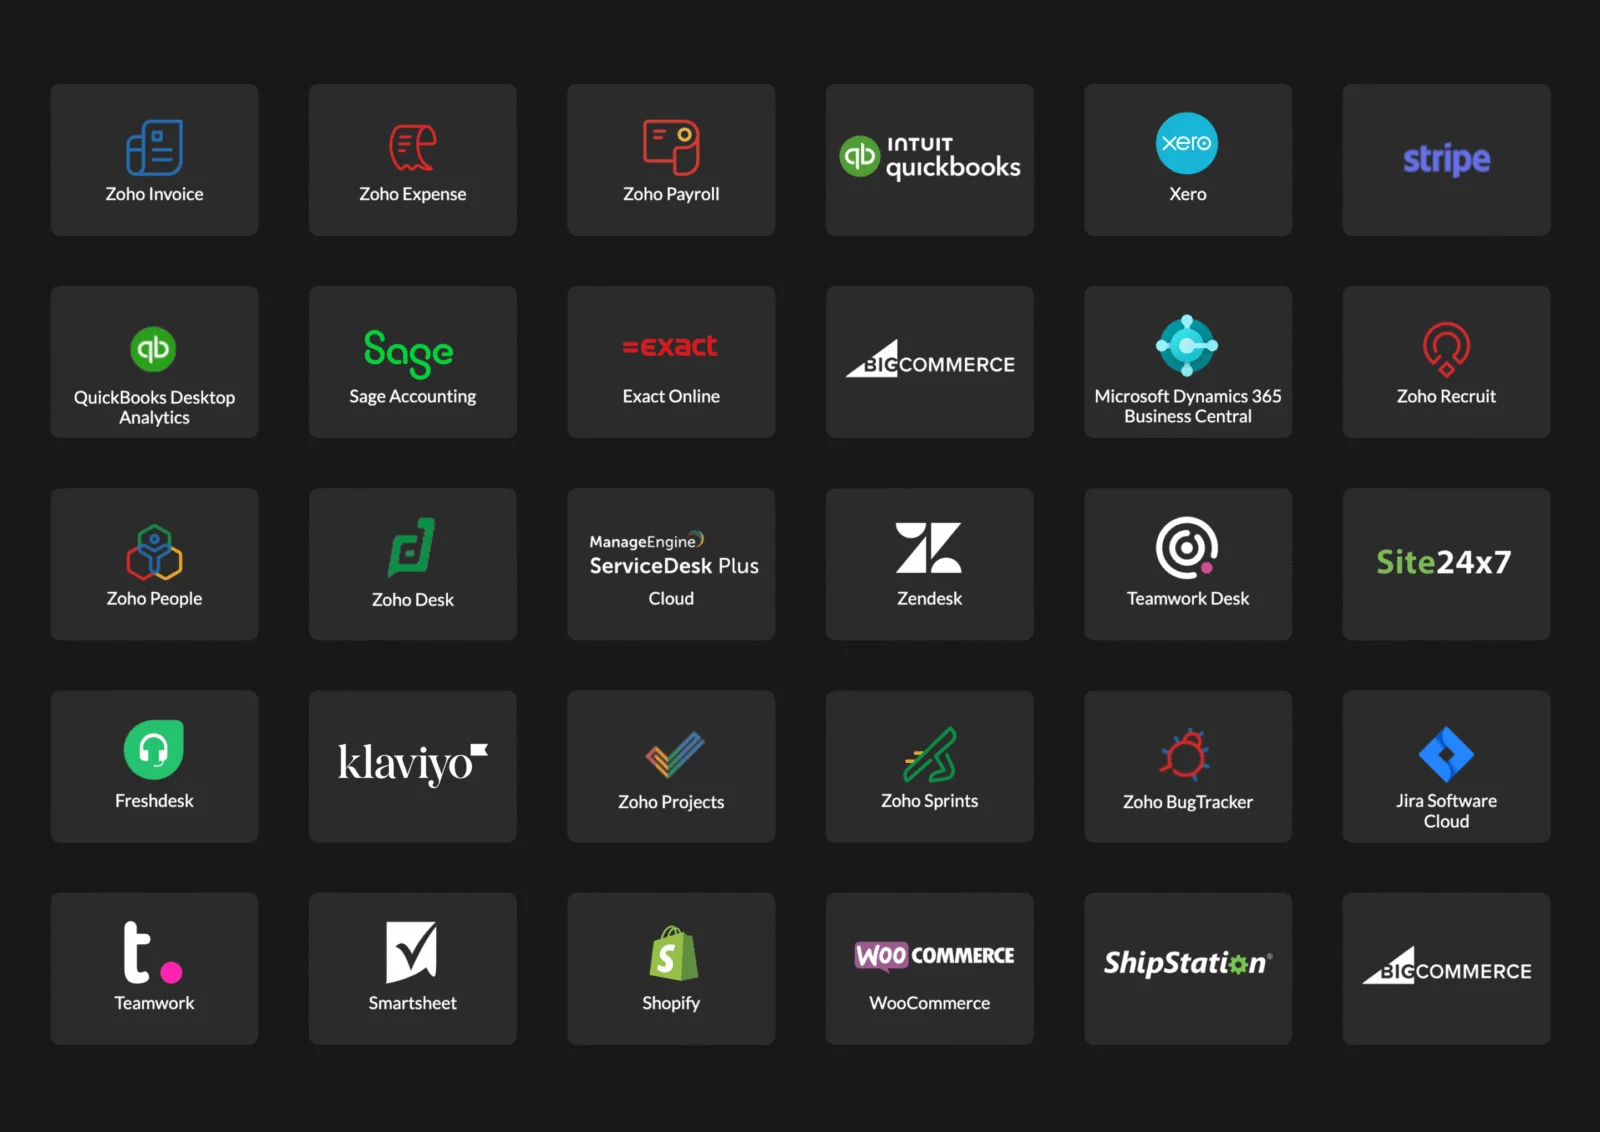
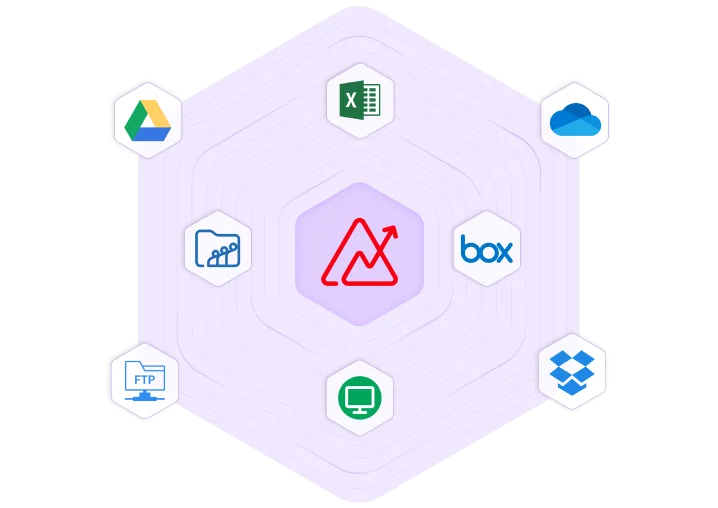
| Data source connectivity | 500+ sources listed by vendor |
| API | REST API; language SDKs available |
| Free plan limits | 2 users, 10,000 rows, 5 workspaces |
| Free trial | 15 days; no credit card required |
| Mobile access | Native iOS and Android apps |
| AI credit model | Plan includes monthly Zoho LLM credits; paid add-on credits available for heavier use |
Verified installation, hosting, administration, or environment details that can affect implementation.
| Hosting | Available as cloud service and on-premises software. Source ↗ |
|---|---|
| Mobile access | Native apps are documented for iOS and Android phones and tablets; on-premises access requires the server to be reachable from the device. Source ↗ |
| AI agent access | The MCP Server is offered as a hosted remote server or an on-premises setup. Source ↗ |
Documented portability, standards, export, or switching considerations. No switching-cost score is shown unless the evidence supports one.
The API supports exporting data and reports in formats including CSV, JSON, PDF, HTML, and image; verify which export formats fit the intended migration.
Evidence source ↗A proprietary editorial score based on product capabilities, usability, value, performance, support and user sentiment evidence.
Scores reflect documented data connectors, preparation, dashboards, APIs, cloud and on-premises options, published plan limits, and public G2 review information. They are editorial assessments, not hands-on test results.
Methodology v1.0. The assessment weighs feature coverage (25%), ease of use (15%), value for money (20%), performance (15%), support (10%) and user sentiment (15%), using researched product evidence and verified review evidence where available. It is a TechZella editorial assessment, not a direct user-review average.
Key claims are linked to the sources used to verify them. This evidence record is separate from third-party user ratings.
TechZella evaluates software using documented product capabilities, pricing information, usability and value considerations, independent user evidence where available, and competitive context. The assessment is an editorial review, not a hands-on test unless one is explicitly identified. Our editorial assessment is based on 5 documented sources.
The product feature page describes more than 500 data sources, preparation capabilities, and reports and dashboards.
View source ↗Verified 2026-11-07The pricing page lists the plans, their starting user and row limits, and annual-billing prices for paid tiers.
View source ↗Verified 2026-11-07The pricing page advertises a 15-day free trial and says no credit card is required.
View source ↗Verified 2026-11-07The API introduction describes REST principles and SDKs for Java, C#, Python, PHP, Go, and Node.js.
View source ↗Verified 2026-11-07The official release page describes the agents, MCP Server, CLI, and gradual feature rollout.
View source ↗Verified 2026-11-07Zoho documents mobile BI apps for Apple and Android phones and tablets.
View source ↗Verified 2026-11-07Answers begin with the clearest available response, followed by the context that helps you act on it.
No reviews yet. Be the first to share your experience.
Please log in to submit a review.