
Prism 11 must periodically connect to verify its license.
The system requirements say a successful connection is required at least once every 30 days or 20 attempts, whichever comes sooner.
Evidence source ↗
GraphPad Prism is desktop software for scientific statistical analysis, curve fitting, and graphing. It supports Windows and macOS, with a Prism Cloud workspace available in beta.
The score reflects documented statistical and graphing capabilities, published plans, system requirements, and G2's public rating and review summary. It is an editorial assessment, not a hands-on test.
This profile combines documented product information and independent evidence where available. It is not a hands-on test unless TechZella explicitly identifies one.
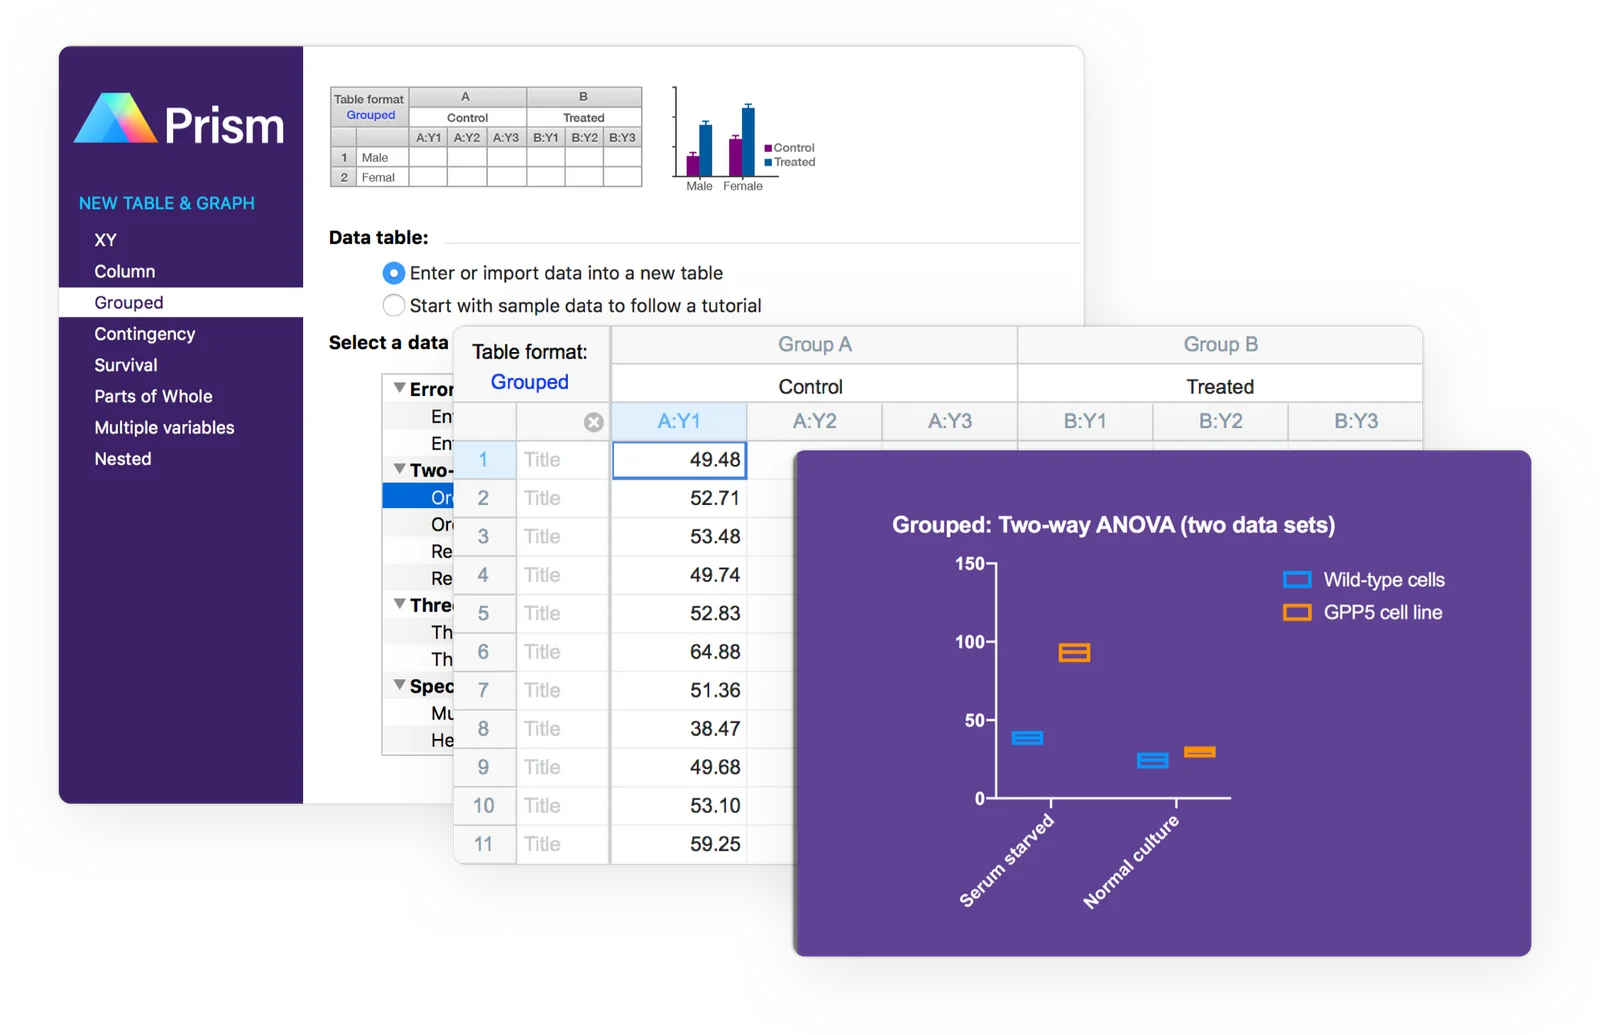
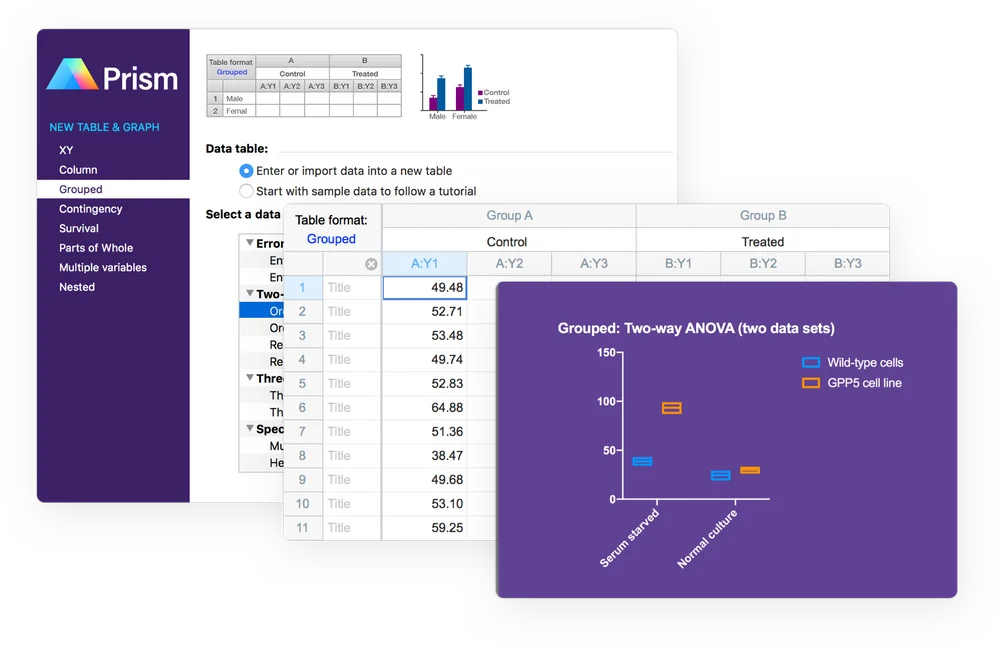
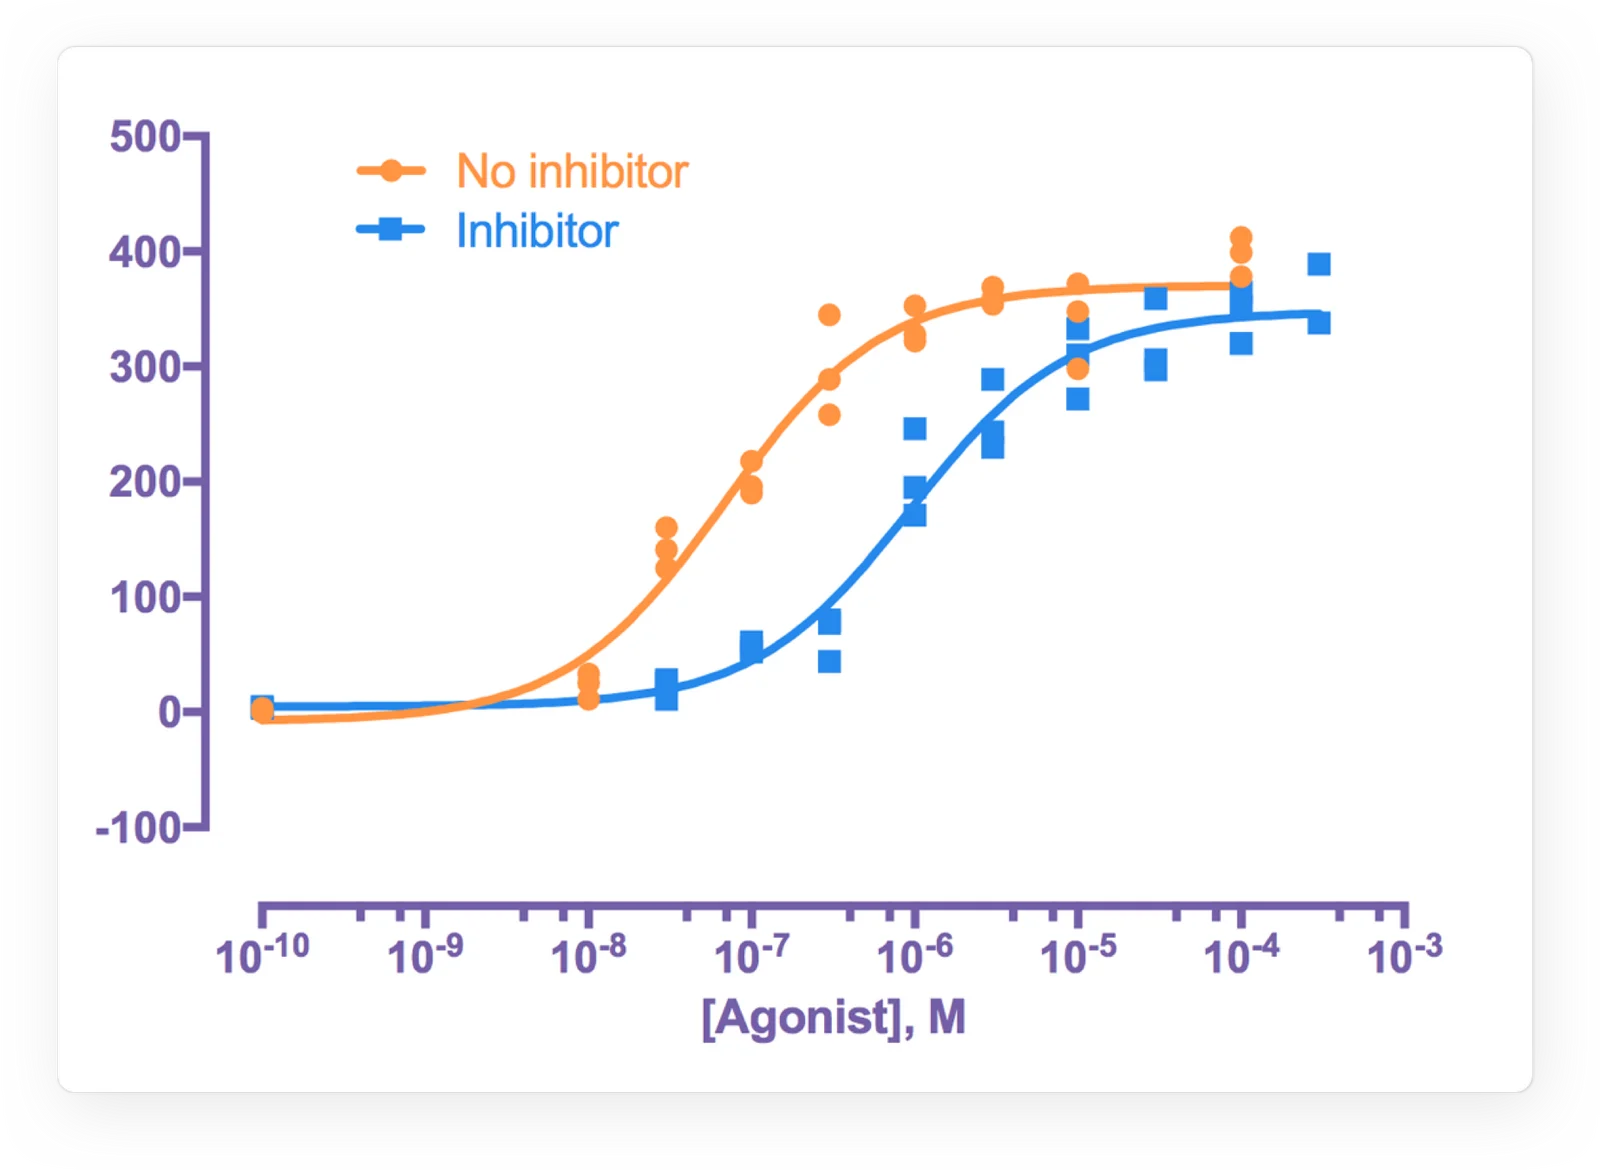
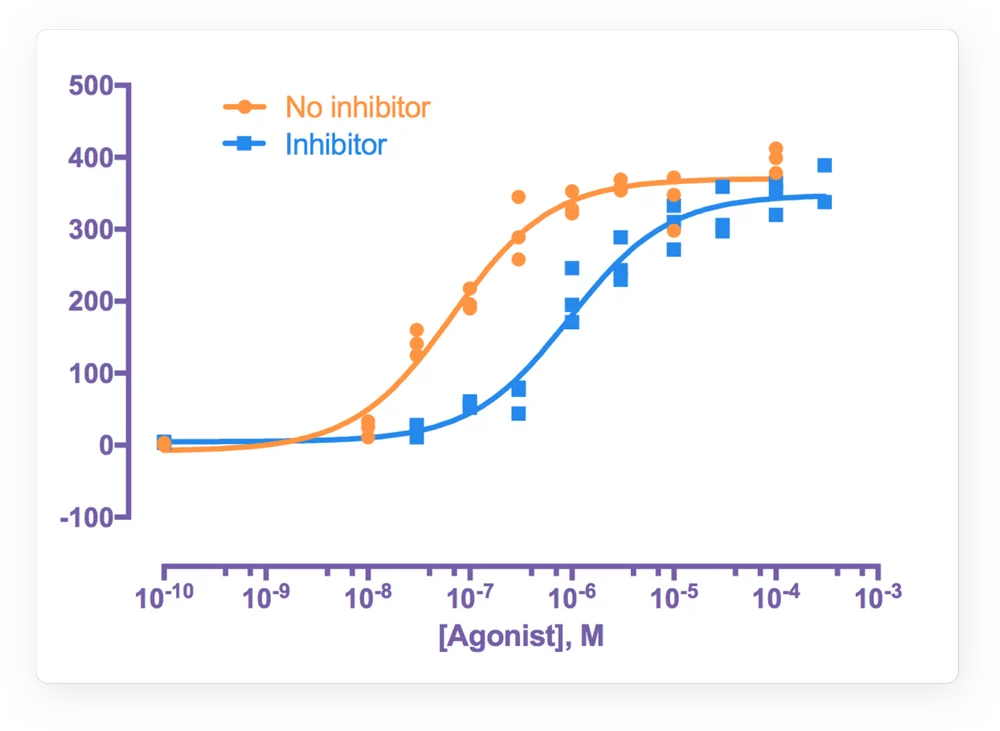
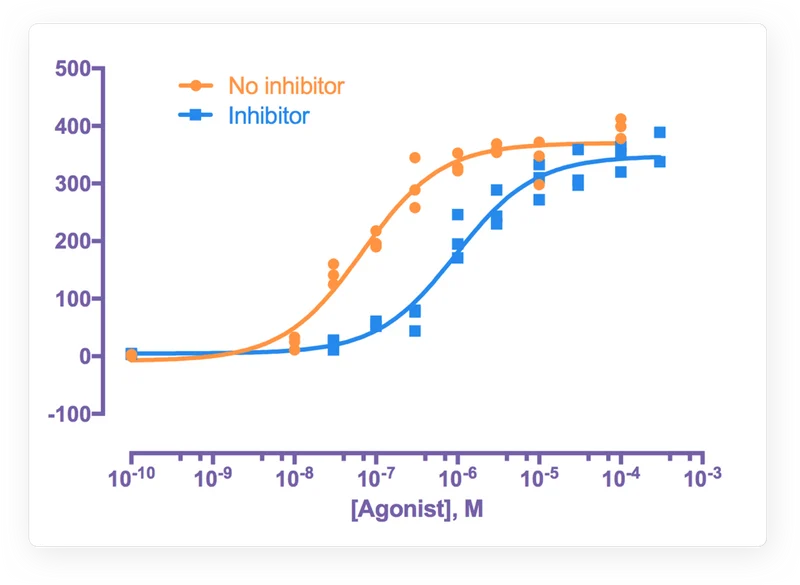
GraphPad Prism combines scientific statistical analysis, curve fitting, and graph creation in a desktop application. Researchers can organize project data in structured tables and connect those tables to analyses and graphs.
Prism runs on Windows and macOS. Its vendor documents a 30-day full-version trial, annual and monthly subscriptions, and group licensing. The product is aimed at research workflows, not general-purpose business intelligence.
A quick way to understand who this product may suit, where its limits matter, and which facts are most relevant before you compare alternatives.
Researchers who want guided statistical analyses, curve fitting, and publication-oriented graphs in a desktop workflow, especially in academic and life-science settings.
Teams that require a callable API, code-driven control of analysis choices, or Windows-to-Mac parity for Excel linking should assess those constraints before purchase, and should evaluate alternatives such as JMP or OriginPro instead.
Cloud, Desktop, macOS, Microsoft Office, Windows
8.1/10
These are the product-specific differences that may matter when deciding whether the software fits your workflow. They are based on documented evidence rather than a universal ranking.
These are documented constraints or practical friction points that may matter before you adopt the product.
The system requirements say a successful connection is required at least once every 30 days or 20 attempts, whichever comes sooner.
Evidence source ↗Teams seeking unattended statistical pipelines or direct application integration may need another tool or a separate workflow.
Evidence source ↗Mac users can copy and paste values or use CSV files, but cannot use the documented Windows Excel-link workflow.
Evidence source ↗Personal subscription for one corporate user. Includes Windows and Mac versions and access on up to two personal devices.
Check current pricing →For an individual who meets GraphPad's academic eligibility criteria and uses Prism exclusively for academic research.
Check current pricing →Student subscription listed by GraphPad.
Check current pricing →Monthly personal subscription for short-term projects.
Check current pricing →Listed price for two corporate seats; five seats are $2,800 per year and ten seats are $5,600 per year.
Check current pricing →Listed price for two academic seats; five seats are $1,300 per year and ten seats are $2,600 per year.
Check current pricing →Group plan with SSO, user provisioning, advanced analysis and graphing, and premium support.
Check current pricing →Pricing may change. Verify current plans on the vendor's website.
Compare similar products directly, then see which alternatives may make more sense when your requirements differ.
| Decision factor | GraphPad Prism | JMP | OriginPro |
|---|---|---|---|
| Annual individual price | GraphPad lists a $520 annual corporate personal subscription. | JMP lists an annual price of $1,390 per user for JMP. Source ↗ | OriginLab lists OriginPro 2026b node-locked annual subscription at $620. Source ↗ |
| Core workflow | Prism combines guided scientific statistics, curve fitting, and graphs in project-based desktop software. | JMP highlights design of experiments, regression, statistical modeling, interactive dashboards, and linked visualizations. Source ↗ | OriginPro adds advanced curve and surface fitting, multivariate statistics, signal processing, and 2D and 3D graphing. Source ↗ |
| Automation and integration | Prism scripts can import data and export results and graphs, but cannot control analyses; the vendor says Prism has no callable API. | JMP describes interactive dashboards and linked visualizations; the cited buying page does not specify a comparable script or API capability. Source ↗ | Origin documents scripting and connectivity with Python, R, MATLAB, LabVIEW, Excel, and its own scripting and C languages. Source ↗ |
Only factors supported by the available research are shown. The comparison is descriptive, not a ranking.
These products address broadly similar requirements. The descriptions focus on documented reasons a buyer might compare them with GraphPad Prism.
| Operating systems | Windows 10 or 11, 64-bit; macOS 12 or later for Prism 11, subject to version-specific changes |
|---|---|
| Deployment | Installed desktop application; Prism Cloud workspace is described as beta |
| API | No callable API; scripting supports limited project, import, and export tasks |
| Excel integration | Windows supports Excel linking and embedding; Mac supports copy-and-paste and CSV import |
| Trial | 30-day full-version trial |
| License verification | Internet connection required at least once every 30 days or 20 attempts, whichever comes sooner |
Verified installation, hosting, administration, or environment details that can affect implementation.
| Installation or hosting | Prism 11 is installed on Windows or Mac desktops. The vendor also describes Prism Cloud workspaces as beta. Source ↗ |
|---|---|
| License management | Group subscriptions include online seat management and support deployment with conventional IT tools. Source ↗ |
Documented portability, standards, export, or switching considerations. No switching-cost score is shown unless the evidence supports one.
Prism's Windows and Mac versions use the same file format, allowing projects to move between the two platforms.
Evidence source ↗Prism can import data and export results and graphs through scripts; text-file import is also documented.
Evidence source ↗A proprietary editorial score based on product capabilities, usability, value, performance, support and user sentiment evidence.
The score reflects documented statistical and graphing capabilities, published plans, system requirements, and G2's public rating and review summary. It is an editorial assessment, not a hands-on test.
Methodology v1.0. The assessment weighs feature coverage (25%), ease of use (15%), value for money (20%), performance (15%), support (10%) and user sentiment (15%), using researched product evidence and verified review evidence where available. It is a TechZella editorial assessment, not a direct user-review average.
Key claims are linked to the sources used to verify them. This evidence record is separate from third-party user ratings.
TechZella evaluates software using documented product capabilities, pricing information, usability and value considerations, independent user evidence where available, and competitive context. The assessment is an editorial review, not a hands-on test unless one is explicitly identified. Our editorial assessment is based on 6 documented sources.
GraphPad lists Windows 10 and 11 64-bit support and macOS 12 or later for Prism 11, with support changes noted for later versions.
View source ↗Verified 2026-11-10The purchase page lists annual corporate, academic, and student personal prices, a monthly option, and group prices by seat count.
View source ↗Verified 2026-11-10GraphPad's trial page states that its trial is the full version and lasts 30 days.
View source ↗Verified 2026-11-10The Prism user guide says a script can open a project, import data, and export results and graphs, and explicitly says there is no API callable from other programs.
View source ↗Verified 2026-11-10GraphPad's updates page identifies version 11.1.0 as the latest and dates its release to August 19, 2026.
View source ↗Verified 2026-11-10The public G2 review page displayed this aggregate score and review count when checked.
View source ↗Verified 2026-11-10Answers begin with the clearest available response, followed by the context that helps you act on it.
No reviews yet. Be the first to share your experience.
Please log in to submit a review.