Editorial overview
Aggregated Overview
The feature assessment reflects vendor-documented graphing, fitting, analysis, imports, and automation. Review evidence praises plotting flexibility but notes usability friction; performance and support scores have limited independent evidence.
This profile combines documented product information and independent evidence where available. It is not a hands-on test unless TechZella explicitly identifies one.
Overview
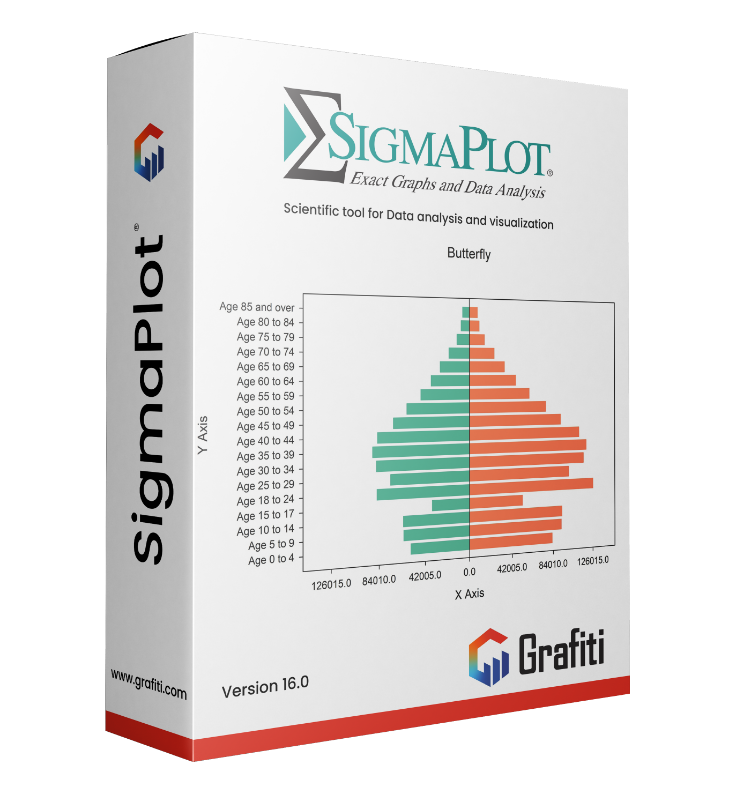
SigmaPlot is Windows desktop software for scientific graphing, statistical analysis, and curve fitting. Its vendor lists more than 100 technical 2-D and 3-D graph types, alongside reporting and data-import tools.
It targets scientists, researchers, and engineers who need to turn experimental or technical data into customized charts and analysis reports. SigmaPlot also supports Visual Basic macros and OLE automation for some Office-linked workflows.
SigmaPlot Decision Snapshot
A quick way to understand who this product may suit, where its limits matter, and which facts are most relevant before you compare alternatives.
Best suited toResearchers and engineers who need specialized technical graphs, curve fitting, statistical analysis, and publication-oriented exports in a Windows desktop workflow.
Look elsewhere ifMac-only users who do not want to run Windows, teams seeking a browser-based collaborative workspace, or buyers requiring a documented REST API, and should evaluate alternatives such as OriginPro or GraphPad Prism instead.
PlatformsDesktop, Microsoft Excel, Microsoft Office, Windows
TechZella assessment7.4/10
SigmaPlot — What Sets It Apart?
These are the product-specific differences that may matter when deciding whether the software fits your workflow. They are based on documented evidence rather than a universal ranking.
- Combines technical graph construction, curve fitting, statistical analysis, and reporting in a Windows desktop application.
- Includes Visual Basic-compatible macros and OLE automation for invoking SigmaPlot from compatible Office applications or custom software.
- Supports a broad range of scientific data imports, including Excel, SPSS, SAS, Minitab, and ODBC-compliant databases.
Editorial assessmentSigmaPlot Pros & Cons
Pros
- Combines scientific plotting, curve fitting, statistical analysis, and reporting in one desktop application.
- Supports more than 100 technical 2-D and 3-D graph types.
- Imports Excel files and supports data from several statistics packages and ODBC databases.
- Visual Basic-compatible macros and OLE automation can support repeated or Office-linked workflows.
- New v16 additions include violin plots, butterfly plots, confidence and prediction bands, and error bars.
Cons
- SigmaPlot v16 system requirements list Windows 10 and Windows 11, not native macOS or Linux.
- New standalone licenses are priced between $899 and $1,599, depending on license type.
- Public vendor materials do not document a REST API.
- Some G2 reviewers report a learning curve or friction arranging data for graphing and analysis.
SigmaPlot Gotchas & Operational Limits
These are documented constraints or practical friction points that may matter before you adopt the product.
SigmaPlot v16 is sold as a standalone perpetual license, and new-license prices vary by license type.
Buyers should select the appropriate academic, corporate, or government license and confirm current variant pricing before purchase.
Evidence source ↗The listed system requirements specify Windows 10 or Windows 11.
Mac-only teams may need a Windows computer or a virtualization setup, and the latter adds deployment and support considerations.
Evidence source ↗SigmaPlot's advertised automation uses Visual Basic compatibility and OLE; public product materials do not describe a REST API.
Automations built around web services or cross-platform API clients may need a different tool or custom integration work.
Evidence source ↗SigmaPlot Pricing & Plans
SigmaPlot v16 new license
$899–$1,599
perpetual
Standalone perpetual license. Product page lists academic, corporate, and government license types; final price depends on the selected option.
Check current pricing →SigmaPlot v16 upgrade from v15
$499
perpetual upgrade
Upgrade listing for users upgrading from SigmaPlot v15.
Check current pricing →SigmaPlot v16 upgrade from v14.5 and earlier
$599
perpetual upgrade
Upgrade listing for users upgrading from SigmaPlot v14.5 or earlier.
Check current pricing →Free trial
Free
trial
Grafiti provides a trial request form for SigmaPlot v16; the page does not specify the trial duration.
Check current pricing →Pricing may change. Verify current plans on the vendor's website.
Cost contextTotal Cost & Hidden Costs
Additional costs or implementation requirements that are documented in the available evidence.
License purchase
The official store lists a new SigmaPlot v16 license at $899–$1,599, with standalone perpetual academic, corporate, and government license types. Upgrade prices differ by previous version.
Evidence source ↗Hosting or infrastructure
SigmaPlot v16 is a Windows desktop product, not a hosted SaaS service; a Windows-compatible computer is required. The vendor lists minimum memory and storage requirements.
Evidence source ↗Implementation and onboarding
The free-trial request page asks for contact and role details, but the vendor does not publicly specify onboarding hours or implementation fees on the pages checked.
Evidence source ↗Ancillary charges and renewal
The vendor lists standalone perpetual license options and paid upgrades. The public pages checked do not specify ongoing maintenance renewal fees or premium support pricing.
Evidence source ↗SigmaPlot Competitors & Alternatives
Compare similar products directly, then see which alternatives may make more sense when your requirements differ.
At a glance
Graphic Design SoftwareOnly factors supported by the available research are shown. The comparison is descriptive, not a ranking.
Direct competitors
These products address broadly similar requirements. The descriptions focus on documented reasons a buyer might compare them with SigmaPlot.
CapabilitiesSigmaPlot Features
Graphing and reporting
- More than 100 2-D and 3-D technical graph types
- Graph wizard and customizable graph properties
- Graph layout, annotations, and multiple axes
- Report editor and graph export options
Analysis
- Linear and nonlinear regression
- Global curve fitting across multiple data sets
- Statistical analysis including t-tests and ANOVA
- User-defined transforms and mathematical functions
Data and automation
- Excel, text, statistical-software, and ODBC database imports
- Microsoft Office and Excel workflows
- Visual Basic-compatible macros and macro recorder
- OLE automation support
SigmaPlot v16 additions
- Violin plots and butterfly plots
- Confidence and prediction bands
- Error bars
- Import multiple Excel sheets
SigmaPlot Specifications
| Operating system | Windows 10 and Windows 11 |
|---|
| Deployment | Desktop application |
|---|
| License model | Standalone perpetual license; academic, corporate, and government license types listed |
|---|
| Memory requirement | 4 GB for 32-bit; 8 GB for 64-bit |
|---|
| Storage requirement | 1 GB available disk space |
|---|
| Office integration | Microsoft Office 2010 or higher for specified Office macros; Excel import and workflow support |
|---|
| Automation | Visual Basic-compatible macros and OLE automation |
|---|
| Free trial | Available by request; trial duration not stated on the vendor trial page |
|---|
| API | Product materials document Visual Basic and OLE automation; no REST API is documented in the product pages reviewed |
|---|
Exit planningMigration & Lock-In
Documented portability, standards, export, or switching considerations. No switching-cost score is shown unless the evidence supports one.
Data portability
The product page documents import and export for Excel, text and comma-delimited data, Access, and a number of statistical-software formats; graph export options include common image and document formats.
Evidence source ↗Our evidence-based assessmentTechZella Score
A proprietary editorial score based on product capabilities, usability, value, performance, support and user sentiment evidence.
7.4/10Moderate confidence
The feature assessment reflects vendor-documented graphing, fitting, analysis, imports, and automation. Review evidence praises plotting flexibility but notes usability friction; performance and support scores have limited independent evidence.
Methodology v1.0. The assessment weighs feature coverage (25%), ease of use (15%), value for money (20%), performance (15%), support (10%) and user sentiment (15%), using researched product evidence and verified review evidence where available. It is a TechZella editorial assessment, not a direct user-review average.
Editorial transparency
Our Review Methodology
Key claims are linked to the sources used to verify them. This evidence record is separate from third-party user ratings.
TechZella evaluates software using documented product capabilities, pricing information, usability and value considerations, independent user evidence where available, and competitive context. The assessment is an editorial review, not a hands-on test unless one is explicitly identified. Our editorial assessment is based on 4 documented sources.
What TechZella adds- Combines technical graph construction, curve fitting, statistical analysis, and reporting in a Windows desktop application.
- Includes Visual Basic-compatible macros and OLE automation for invoking SigmaPlot from compatible Office applications or custom software.
- Supports a broad range of scientific data imports, including Excel, SPSS, SAS, Minitab, and ODBC-compliant databases.
Important limitations- The current system-requirements page lists Windows 10 and Windows 11, not native macOS or Linux support.
- The vendor lists new licenses as standalone perpetual licenses, rather than a cloud-hosted subscription service.
- Public product materials describe Visual Basic and OLE automation but do not document a REST API.
- Public product materials do not state trial duration on the free-trial form page.
Evidence-backed claimsSigmaPlot v16 supports Windows 10 and Windows 11.The vendor's system requirements page lists Windows 10 and Windows 11.
View source ↗Verified 2026-11-10New SigmaPlot v16 licenses are available for $899–$1,599.The official product listing displays this price range and identifies academic, corporate, and government standalone perpetual license types.
View source ↗Verified 2026-11-10SigmaPlot documents more than 100 technical graph types and global curve fitting.The product page describes more than 100 2-D and 3-D graph types and fitting of multiple data sets simultaneously.
View source ↗Verified 2026-11-10SigmaPlot supports importing Excel data and using Excel and Office workflows.The product page describes Excel imports and access from Excel, as well as presenting graphs in PowerPoint and embedding results in documents.
View source ↗Verified 2026-11-10SigmaPlot supports Visual Basic-compatible macros and OLE automation.The vendor product page documents macros, automation object support, and calling SigmaPlot through Visual Basic and OLE2 automation.
View source ↗Verified 2026-11-10SigmaPlot v16 added violin and butterfly plots, confidence and prediction bands, error bars, and importing multiple Excel sheets.Grafiti's v16 feature page lists these capabilities as version 16 additions.
View source ↗Verified 2026-11-10 Independent review sources
SigmaPlot Ratings & Reviews
Ratings are published by the respective review platforms and may change over time.
FAQ
See the product-specific buyer questions and sourced answers in the FAQ field. The answers cover the free trial, Windows requirements, licensing, Excel and Office workflows, and automation.
Community feedback
Reviews
No reviews yet. Be the first to share your experience.
Write a Review
Please log in to submit a review.
Recently added Graphic Design Software